Optional: Debug Practice
This optional exercise is meant to help you debug C programs using VSCode. I'm thankful to Sitao Wang for creating this exercise, please direct any changes to the document or code to him. Also, please let me know if this exercise was helpful, if so it will be added to the course in future offerings.
Set Up VSCode Tasks
- Setup build tasks in
.vscode/tasks.json. Below is an example for this practice.
{
    "tasks": [
        {
            "label": "Configure: debug practice",
            "type": "shell",
            "command": "meson setup builddir",
            "options": {
                "cwd": "${workspaceFolder}/debugging-practice"
            },
            "runOptions": {
                "runOn": "folderOpen"
            }
        },
        {
            "label": "Compile: debug practice",
            "type": "shell",
            "command": "meson compile -C builddir",
            "group": "build",
            "options": {
                "cwd": "${workspaceFolder}/debugging-practice"
            }
        }
    ]
}
- The configuration task should run when you re-open the folder. You can also run it manually through Command Palette Tasks: Run Task.
- Create a launch target configuration in
.vscode/launch.json. Below is an example for this practice.
{
    "configurations": [
        {
            "name": "Debug: debug practice",
            "request": "launch",
            "type": "cppdbg",
            "MIMode": "gdb",
            "cwd": "${workspaceFolder}/debugging-practice/builddir",
            "program": "${workspaceFolder}/debugging-practice/builddir/example",
            "args": [],
            "stopAtEntry": false,
            "preLaunchTask": "Compile: debug practice"
        }
    ]
}
- Now everything is setup. Click the Debug/Run icon on the upper right side or
Run > Start Debugging or hit
F5to test the setup.
Walkthrough
With debugger setup, let's try out an example.
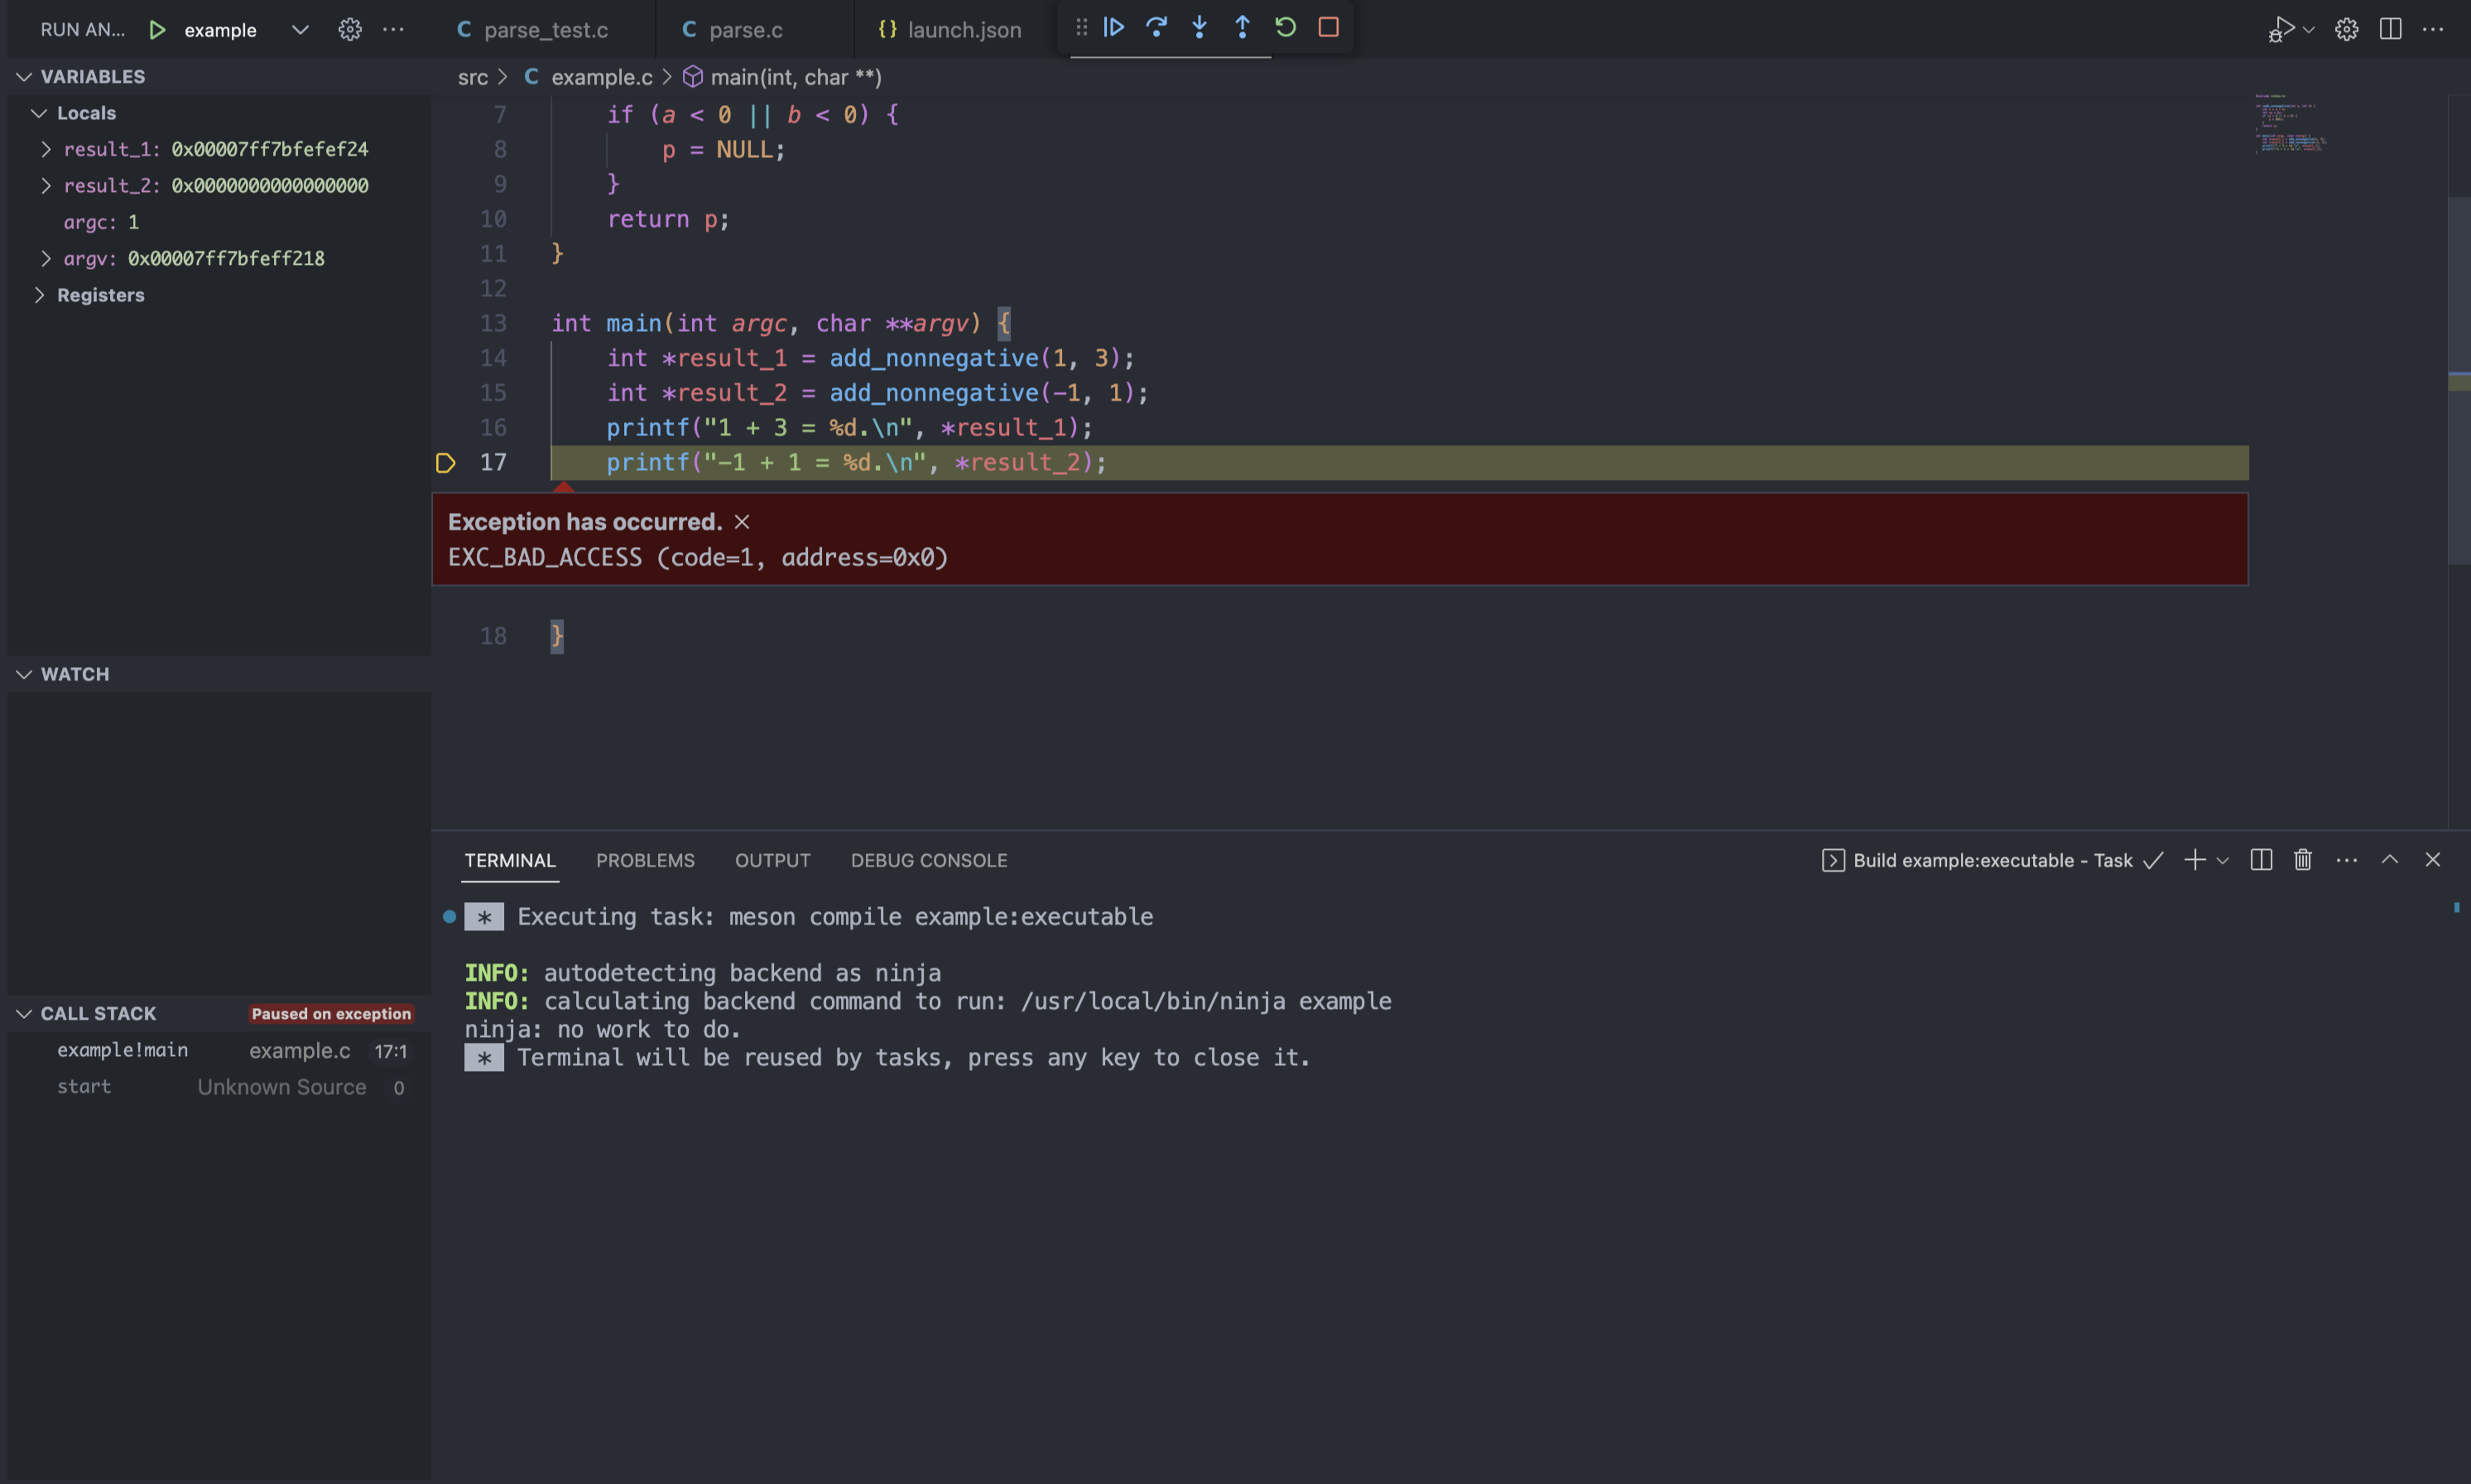
If you try running debugger in previous step, VSCode with open up example.c,
with a warning message that exception has occurred.

The warning message suggests that we are accessing a memory address that we are
not allowed to, a.k.a segment fault. It also shows that the offending address is
0x0. We can check the VARIABLE section on the left panel that result_2 has a
value of 0x0, and we are dereferencing it.
The solution is simple, check if a pointer is NULL before dereferencing it.
Hold up before you cheer. Another bug still exists. Let's check the DEBUG
CONSOLE, and wee will see that the program prints 1 + 3 = 0, and my math
teacher tells me that's wrong.
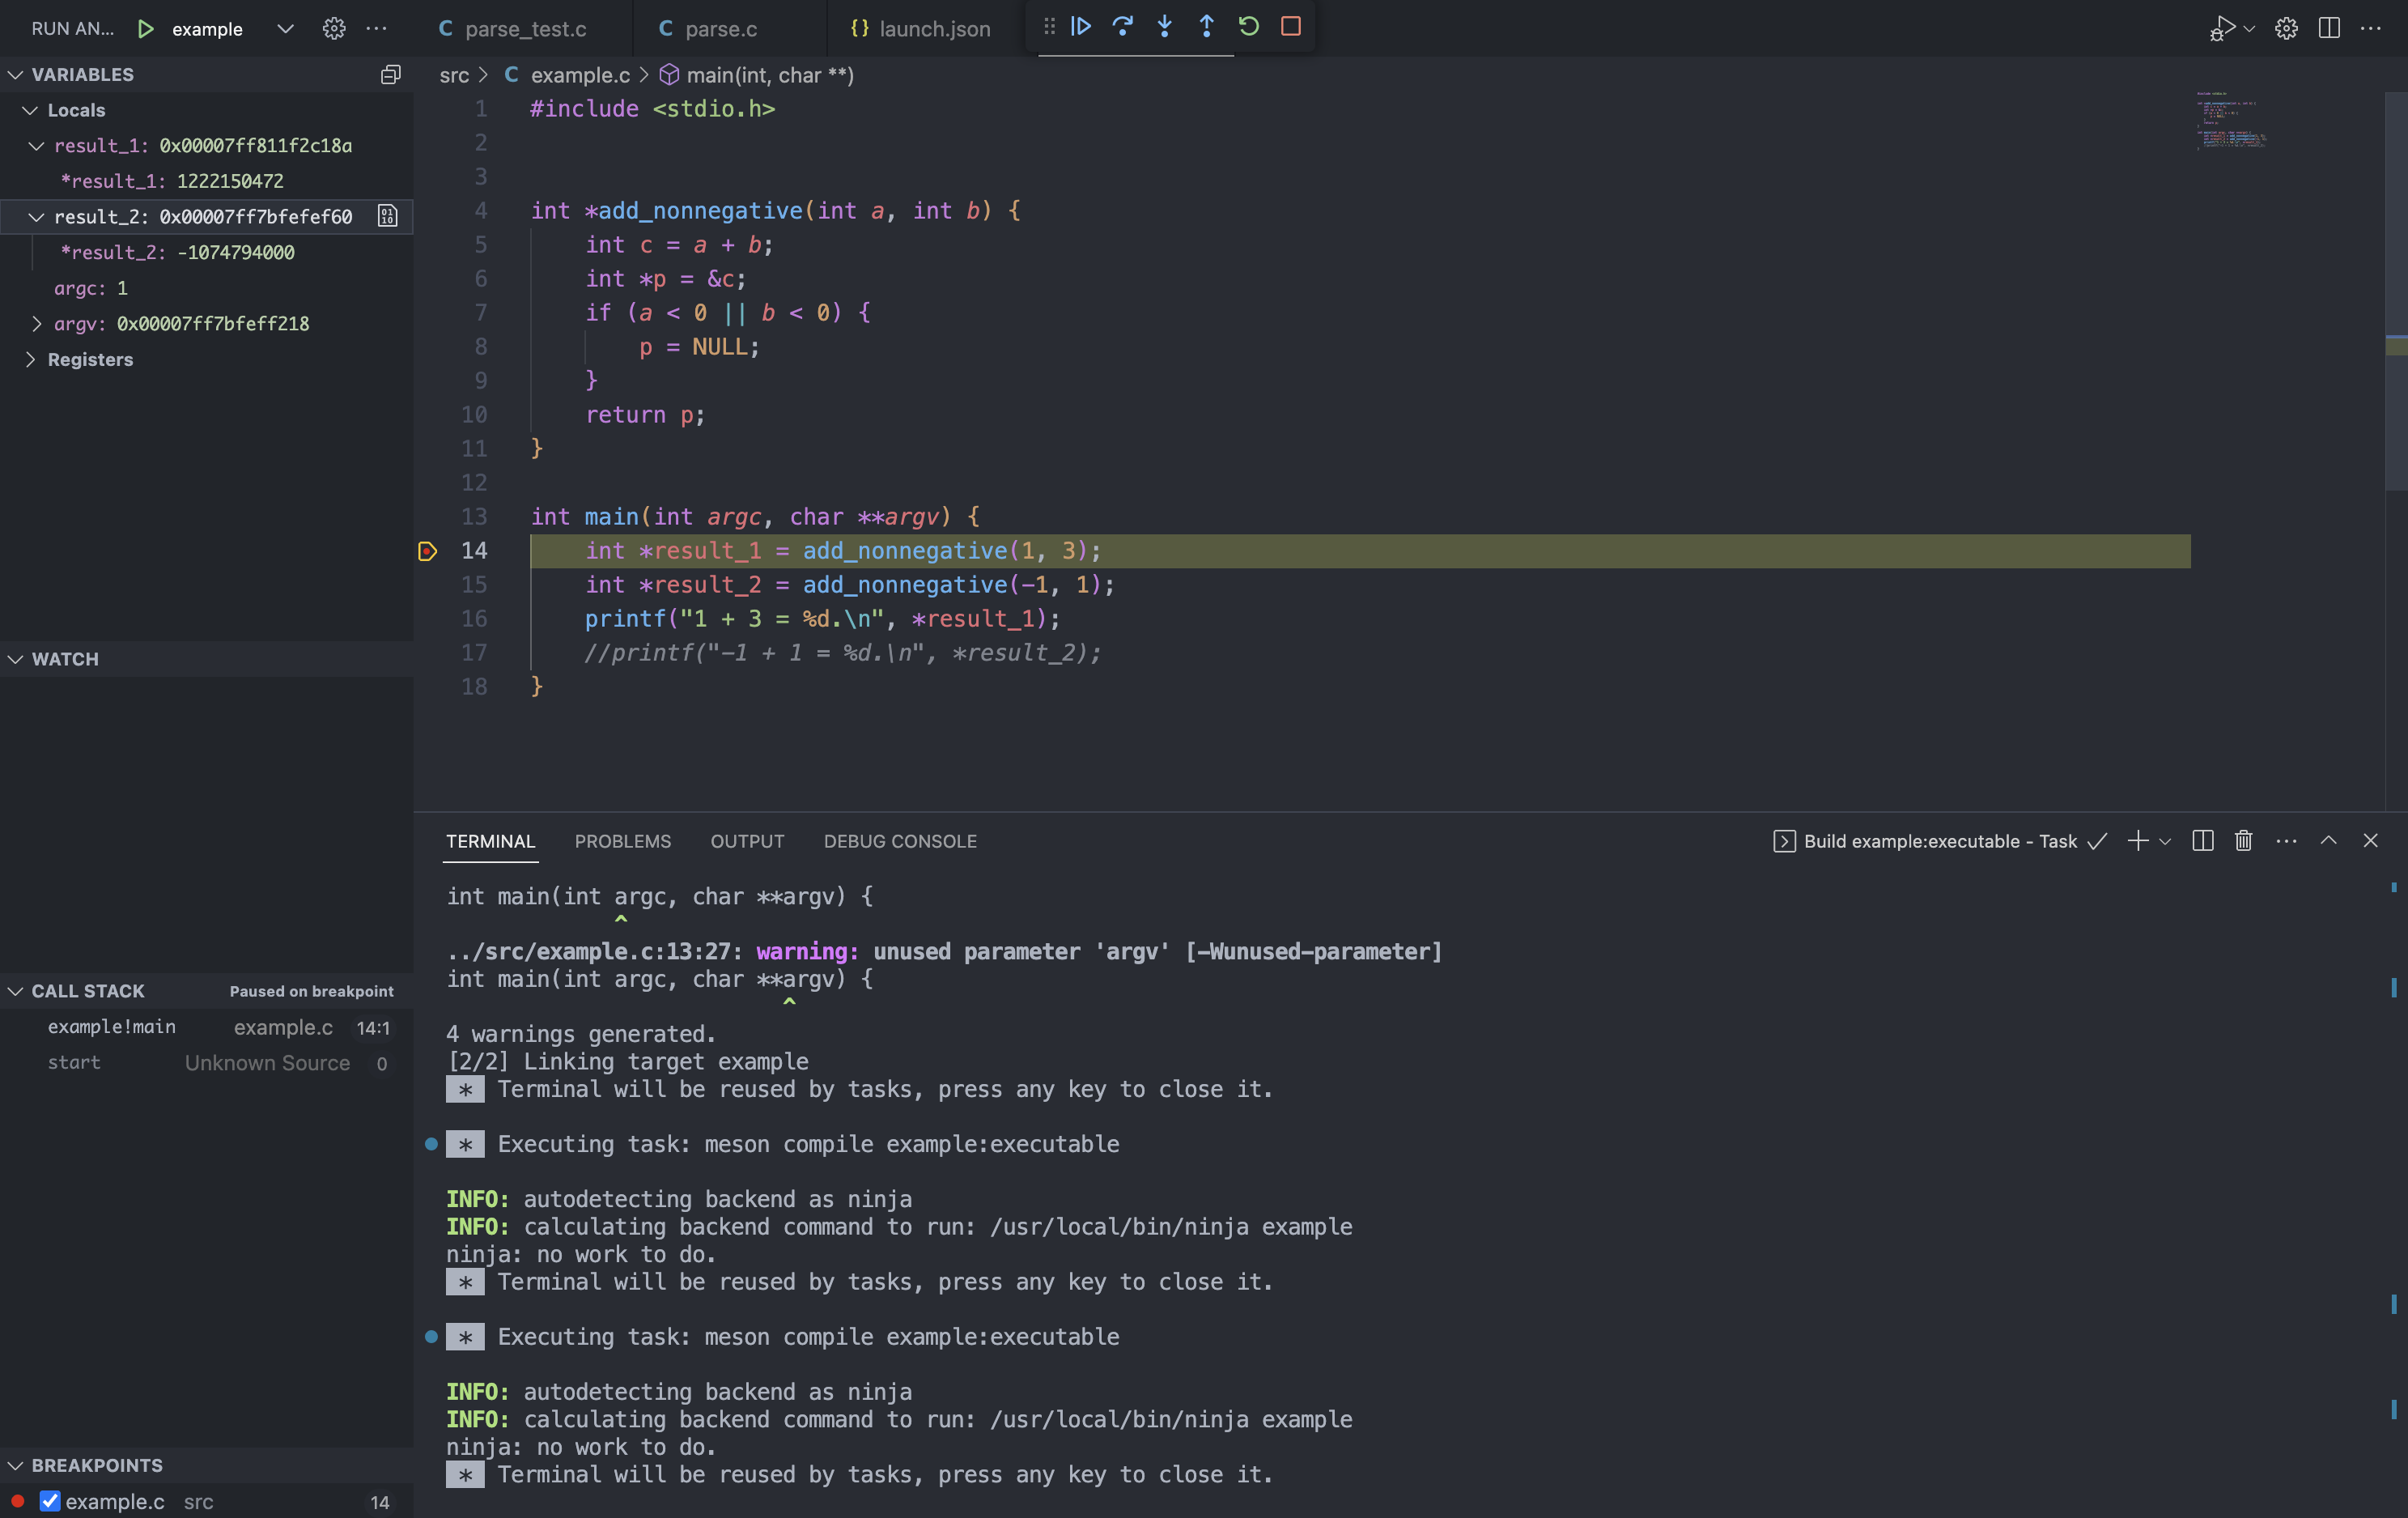
This bug is more tricky. We need to step through the program to see what happens. GDB provides a great tool calls breakpoint. We can click on the left side of the line number in interest, 14 in this case. GDB will pause before executing this line. Let's start the debugger again.

There's a toolbar in the upper middle of the editor. From left to right, they are "continue", "step over", "step into", "step out", "restart", and "stop". Continue means resuming execution until the next breakpoint. Step over means executing the current line and stop. Step into means resuming execution and stop right after the calling function starts. If there is no function call, it is same as step over. Step out means resuming execution until the current function finishes.
Let's try clicking step over, and see that after line 14, result_1 points to
4, the expected result. Step over again and it turns to 0. We can restart and
break at line 15 instead. Stepping into the function, VARIABLE changes to
display the local variables of the current function. Notice that c is 4. On
CALL STACK, click example!main to view local variables on the main function
stack, and result_1 still points to 4. Stepping over to line 6, we can see
that c changes to 0, and so does the value result_1 points to.
Now we can see that the root cause is returning a pointer to a memory address on current function's stack. That memory is no longer valid after function returns. The next function call can easily overwrite the memory.
Let's pause for now and think about why the add_nonnegative function returns a
pointer instead of an integer. This function adds up two non-negative numbers,
and if one of the argument is negative, it needs to report an error. Now the
program chooses to report the error by returning a NULL. The correct
implementation in this case need to allocate an integer on heap and returning
its address. This approach works, but has two downsides. First, memory
allocation introduce significant performance overhead. Second, the caller of the
function now bears the burden to free the memory when it is no longer needed.
Thus, returning a pointer to signal an error seems not worthwhile.
When we need to return more than one information, we generally have two options. First, we need to check if we can pack this information into a small piece of data that can be efficiently returned. If we pack all information into a large struct, copying it across function stack wastes time and memory. In our example, it is possible. Because sum of two non-negative numbers cannot be negative, we can return a negative number to represents an error. If compacting information is not possible, we are left with another option. The function can "return" most of the information in argument. More precisely, function can accept pointers as "output argument", and the function will write to the value pointed by the pointer. This pattern is widely used in C programming to work around the language limit.
Adding Debugging to Other Labs
Now with some debugging experience, we can start using it in labs. Add new
entries to tasks.json and launch.json, and launch the debug session. The
tests come with the code are also runnable, which means you can also add them
in launch.json and debug just the test you want.